Unlocking OroraTech’s Land Surface Temperature Product: From Urban Heat Islands to Modern Irrigation Management
The world is changing due to global warming and the need for accurate worldwide temperature monitoring has never been more important. The IPCC (Intergovernmental Panel on Climate Change) at the United Nations recently defined LST as an Essential Climate Variable, meaning its use has been identified as incredibly important to fighting climate change. The data it provides applies to many different facets, including irrigation management & water management, silviculture & forestry, and city planning & urban temperature assessment. Whether it be in urban or rural areas, our thermal network can easily measure large parts of the Earth using our Land Surface Temperature (LST) Product provided by our thermal sensor network!
When it comes to how heat affects the world around us, it’s important to understand how there are large variations depending on the land cover (i.e. the makeup of objects, buildings, plants, etc.) around you. There are generally pretty large contrasts in how heat is absorbed or reflected between cities and the countryside, as different materials have various levels of emissivity. Cities, with large amounts of concrete, tend to retain this thermal energy that can create heat islands when compared to the surrounding countryside.
Land Surface Temperature Product in Action
The heat map below shows Sacramento, the capital city of California, and its surrounding area. To the east of the city, you can see how the coniferous fir trees and majestic mountains of the El Dorado National Forest are naturally much cooler than the city itself, as they retain less heat. Also to the east, the hotspots of Folsom Lake, Camanche Reservoir, and Lake Tahoe immediately stand out. These large bodies of water have huge capacities to store heat energy, almost like a battery. Even when it gets colder during the night, they only slowly lose heat, making them rather constant in temperature. If you look north of Sacramento, you can see very warm commercial farmland that follows the same principle. These regions are known for moisture-intensive rice farming and nut cultivation, therefore retaining consistent temperatures. Meanwhile, the areas surrounding are much cooler, owing to the region’s historic farming tradition.
A temperature map of Sacramento, CA, and the surrounding region, taken on November 26th, 2023 at 1 am, EST
This data allows you to spot many things. If you are an urban planner, you can clearly and easily see the hotspots of a specific city, planning for city parks that give heat relief to your local citizens. If you are a farmer, this data allows you to plan growing seasons based on temperature, dialing in the exact correct times to grow necessary crops. Beyond simply measuring cities and farms, the technology is flexible enough to allow commercial operations and governments also to track evapotranspiration (water evaporation from the soil), inform wildfire risk, do silviculture analysis, soil carbon estimations, and much more.
The satellite-based nature of these measurements has many advantages, including the ability to measure the temperature of remote/extreme locations (like the deep Amazon rainforest) and being able to observe large swaths of land at a given time. While public land surface temperature missions have largely paved the way for the development of scientific endeavors, the usability by commercial entities has been limited. We aim to change that.
Measuring Earth’s Temperature with the Infrared Spectral Range
All orbit-based LST solutions don’t measure the direct temperature of the ground, but instead the radiative temperature of natural infrared radiation. All matter (above absolute zero) in the universe emits thermal infrared radiation. The higher the temperature of an object, the more atoms move around within the object, and therefore the more infrared energy is being emitted. With suitable detectors onboard satellites, we can then measure that emission and estimate the temperature of its source.
However, it’s not as simple as pointing the sensor at Earth and getting a reading, as we must first solve for the radiative transfer equation. To begin, we obtain the specific atmospheric conditions present at the time of image capture, essentially measuring water vapor, ozone, and other important factors using common weather models. This is because the measurements taken must be corrected with these conditions in mind. Once we do that, we then must also estimate the varying emissivity of the surface on a per-pixel basis, as not every material is the same (essentially, how emissive a forest is vs a paved road). Our algorithm leverages decades of research into the modeling of surface emissivity based on vegetation and land cover information. An example of this entire process is visualized below:
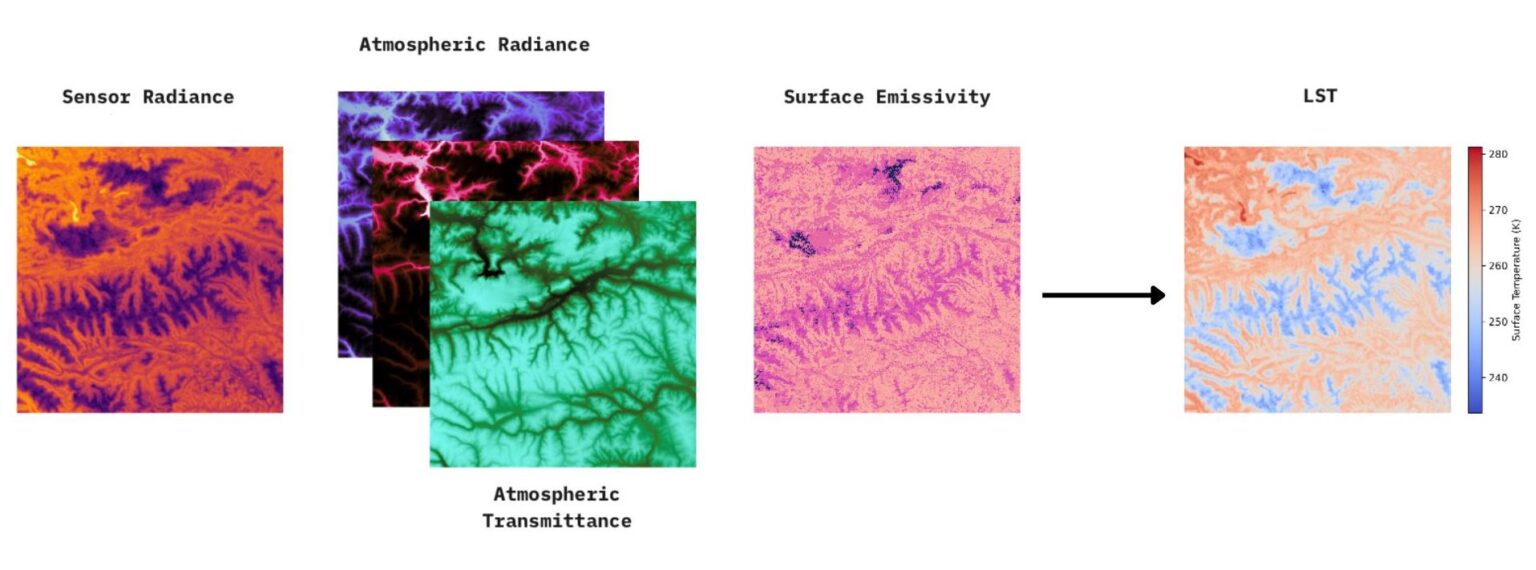
The ingredients of our LST Product: Radiance, Atmospheric Conditions, and Surface Emissivity. Together they produce the underlying surface temperature.
At this point, you may be asking yourself: why don’t we just use temperature sensors here on Earth? Why go through the process of launching a satellite if we can directly measure the temperature of an object right here? While there are many obvious benefits when measuring from a satellite (the ability to measure anywhere on Earth at a given moment, have a large swath of data to show differences between areas, measuring temperatures at inhospitable or inaccessible locations), it’s important to realize that one method does not replace one another, and they often work together. For example, we calibrate the readings of our infrared detectors based on the temperature measured from ground sensors to be sure we are measuring correctly. Below you can see how we use buoys in Lake Tahoe to measure whether our orbital readings are correct.
The location of NASA buoys on Lake Tahoe, CA. We use ground stations to fine-tune our orbital temperature readings.
Land Surface Temperature: A Product with Numerous Use Cases
While we are primarily known as Wildfire detection specialists, our thermal intelligence technology can be used in numerous ways, including land surface temperature readings! Our orbital instruments are equipped with a single Mid-Wave Infrared (MWIR) and two Long-Wave Infrared (LWIR) sensors, scanning our planet every day to provide amazing insights. We have identified many use cases that we can facilitate right now:
- Irrigation Management: Effective irrigation management relies on precise information about the land surface temperature to optimize water usage. Sub-daily measurements offer a more granular understanding of how surface temperatures fluctuate throughout the day. This enables farmers to identify optimal irrigation periods, aligning water supply with peak temperature variations. By closely monitoring land surface temperatures on a sub-daily basis, irrigation systems can be fine-tuned to meet the specific needs of crops during critical growth stages. This leads to water efficiency and more sustainable agricultural practices saving water.
- Wildfire Management: The management of wildfires is a multi-stage process, including pre-fire and post-fire management as well as the handling of ongoing fire events. Our Land Surface Temperature Product is beneficial for both the pre- and post-fire stages. Research has identified this methodology as a key variable in predicting surface conditions that increase the likelihood of wildfires igniting. Furthermore, it can be used to track the burn scars of a wildfire. This is because a fire greatly impacts the soil moisture content and surface emissivity of affected areas. These become easily visible in land surface temperature products as the burnt surfaces show a different temperature signature when compared to their environment.
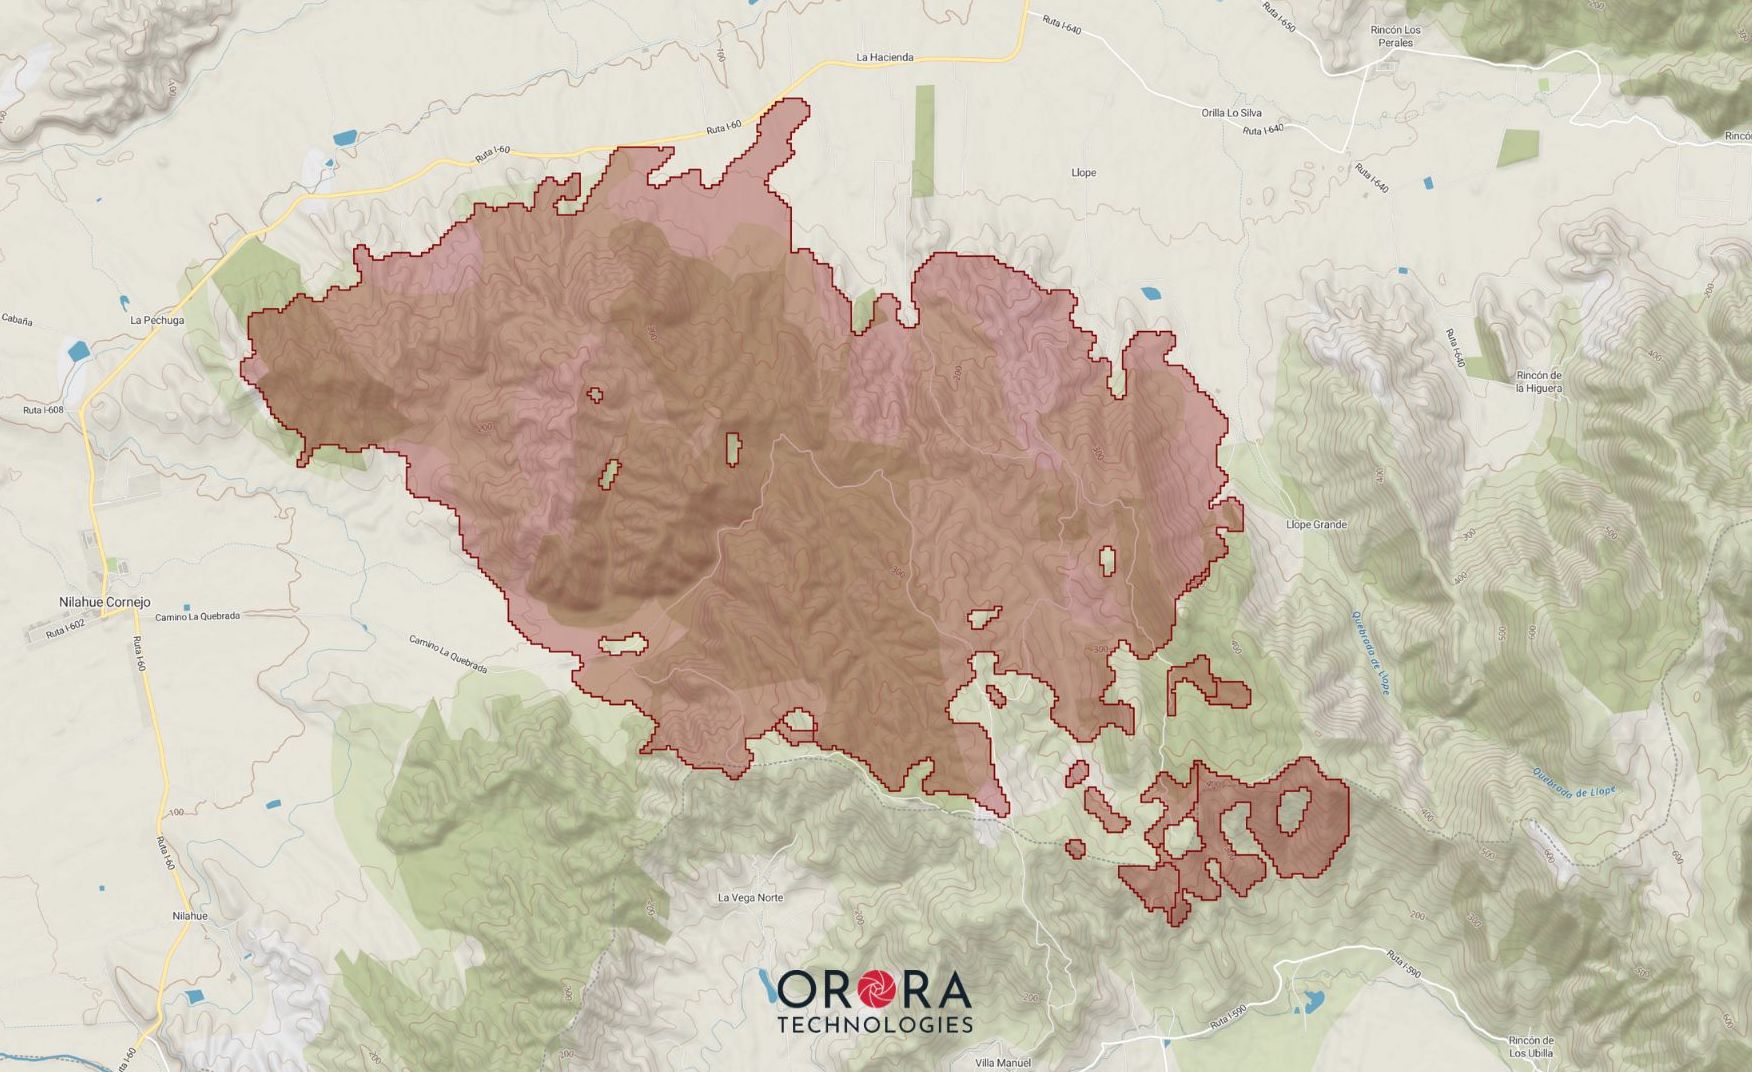
An approximation of the burnt area outside of Nilahue Cornejo, Chile. February 16th, 2024.
- Forestry & Silviculture: Many commercial forestries perform controlled irrigation for large tree plantations to monitor performance and increase productivity. Silviculture focuses on finding the perfect combination of tree species for the given climatic conditions, soil, and surface types as well as water availability. Thus, frequent data on a large scale enables these users to improve the monitoring and management of the cultures.
As we expand our sensor network, our goal is to provide 30-minute revisit rates for any specific area. This cadence allows us to be able to produce brilliant images with full day & night coverage, allowing us to evade cloudy acquisitions and provide a dense temporal time series of the conditions on the ground.
A time-lapse day/night land temperature simulation of the Sacramento Valley in California. We expect images like this to be possible in 2026 as we expand our network of thermal sensors.
Land Surface Temperature Measurements: Now & Into the Future
Being able to measure land surface temperature for orbit is paramount for making critical decisions and accurately measuring the effects of climate change. Measuring these changes allows many people around the globe to use our data, allowing for better food production, more comfortable cities, and keeping our communities safe. Our data measurements can truly make a difference, with daily overpasses worldwide starting in early 2025 and temporal density improving throughout our planned sensor launches. For more information and to schedule your land surface temperature overpasses with our FOREST-2 sensor, schedule a demo with our thermal imaging experts today!
