OroraTech's High-Resolution Burnt Area Feature: Transforming Fire Management in Forestry, Insurance, and Agriculture Industries
When a large wildfire strikes, the damage can be devastating and long-lasting. In the aftermath, effective management and recovery efforts rely on a thorough understanding of the affected area and the extent of the destruction. That's why our team has been hard at work developing innovative solutions to support wildfire response and recovery efforts.
Today, we are excited to unveil the latest addition to our cutting-edge Wildfire Solution platform: the Burnt Area Mapping feature. This new feature represents a significant leap forward in our efforts to provide a more comprehensive evaluation of the impact of large fires on the affected area.
By leveraging the power of advanced mapping technology, Burnt Area Mapping enhances post-event analysis, improves pre-event preparation, and supports effective and sustainable fire management efforts.
Our new Burnt Area feature will be highly beneficial to various industries, providing answers to their pressing topics:
- Forestry industry: Identify which trees were impacted and assess the extent of topsoil damage.
- Insurance industry: Get detailed insights into compensation claims based on the extent of the affected area, and validate customer claims using the Burnt Area feature.
- Agriculture industry: Evaluate the amount of biomass lost and the impact on specific habitats, including the expected time of recovery.
How the Burnt Area Feature Enhances Fire Management beyond Early Detection
While timely hotspot detection is crucial to combating fires, accurate information on the affected area and damage caused is equally important in assessing the extent of the damage.
With the Burnt Area feature, our Wildfire Solution platform analyzes data from over 20 satellites to provide real-time information on active fires, allowing for timely customer notification. Burnt Area provides critical information on the area impacted by fires, the level of vegetation and topsoil cover damage, and more, enabling comprehensive post-event analysis and sustainable fire management practices.
The Burnt Area feature's value is bolstered by our extensive data sets of active fires collected over the last 4 years. This data allows us to complete a thorough post-event analysis of a patch of burnt ground as small as 10x10 meters and enables us to conduct new analyses such as rapid damage assessment for insurance claim management.
Assessing a Fire in Queensland with the Burnt Area Feature
Our Wildfire Solution proved to be an effective tool for detecting wildfires many times. In December 12, 2022, our Burnt Area feature identified a hotspot in Forest Den National Park, Queensland. Within just 48 hours, our platform detected over 7690 additional hotspots, with the fire spreading across an area of 248 square kilometers. Our technology's impact can be seen in the before-and-after images of the affected area below.
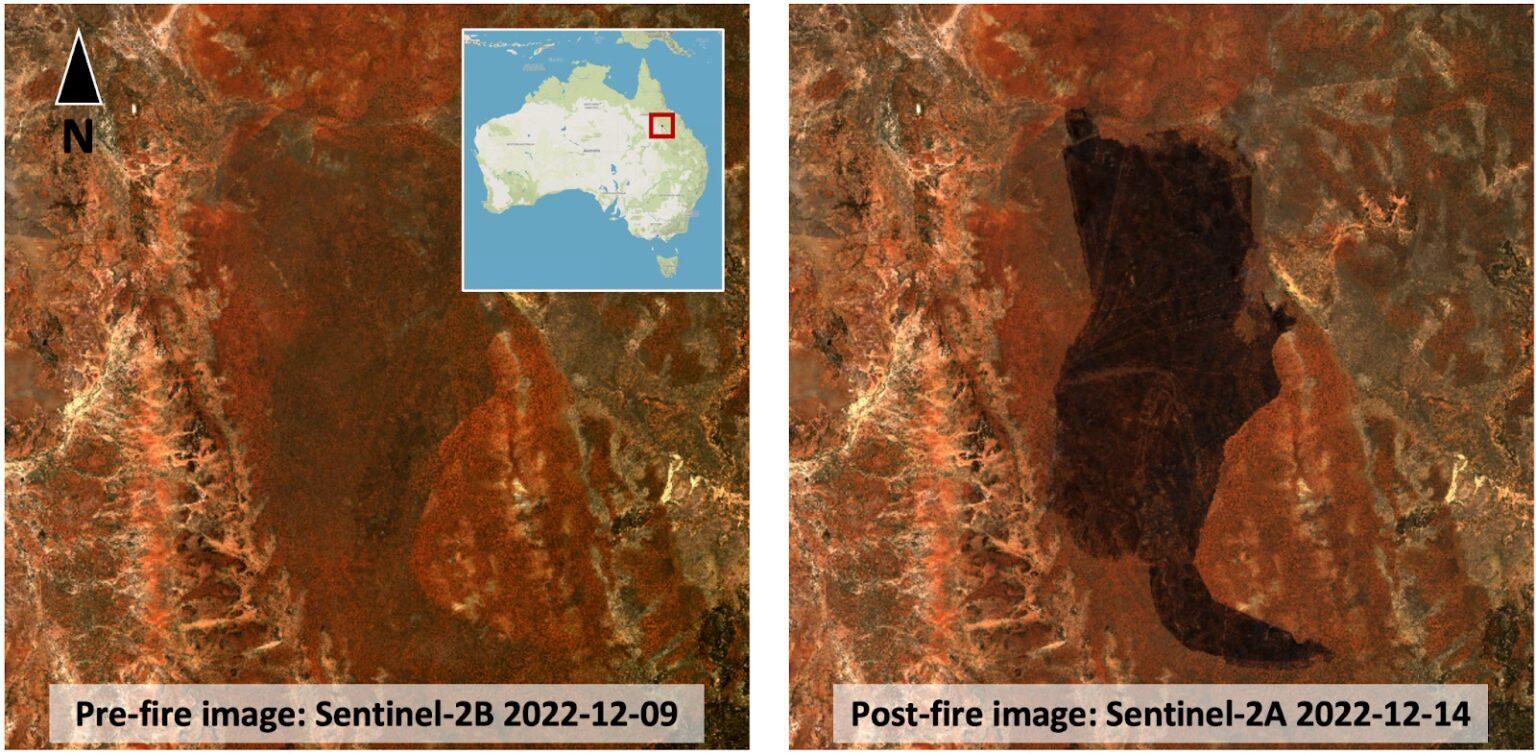
The Sentinel-2A acquisition from December 14, 2022, shows the burnt area of the wildfire, with our Active Fire feature detecting and monitoring thermal hotspots to provide early wildfire detection. In this initial detection phase, accurate knowledge about the fire's location is crucial, but the most critical parameter is the time to detection. Therefore, our system uses every possible data source to spot the blaze faster, even with a moderate resolution of about 500m to 2000m per pixel.
Our Active Fire detection system employs sensors that offer varying levels of resolution, ranging from 10 meters for low Earth orbit satellites to 2 kilometers for geostationary orbit satellites. After the initial detection phase, we move into a comprehensive monitoring and post-event analysis phase, where our Burnt Area technology plays a critical role.
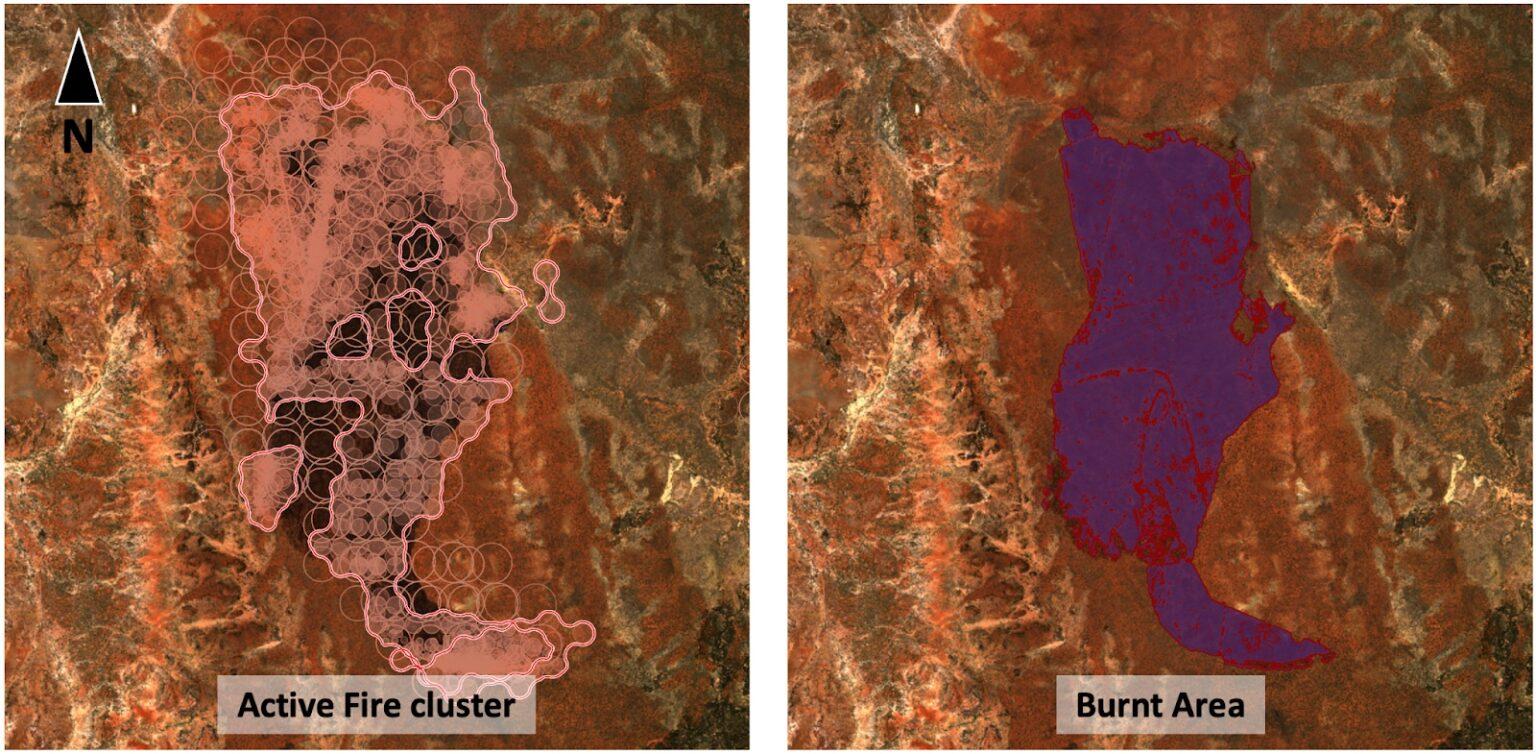
The left-hand side displays the Active Fire feature, showcasing a large fire cluster with thousands of individual hotspot detections represented by smaller circles. However, as is common with satellite imagery, there are gaps in the data caused by thick clouds obstructing the view during overpass. Despite this, the feature provides a reasonably accurate outline of the affected area. However, it is important to note that the feature tends to overestimate the affected area, assuming the worst possible scenario of detected hotspots for a certain period and their proximity.
On the right-hand side, our new Burnt Area feature presents a highly detailed depiction of the burnt ground, accurately mapping the affected area in red. In contrast to the Active Fire feature, the Burnt Area provides an accurate, high-resolution mapping of the areas that were already burnt as a result of the fire. This is achieved through a unique algorithm that detects the signature of burnt soil based on the reflected sunlight in the near-infrared (NIR) and short-wave-infrared (SWIR), unlike Active Fire's thermal anomaly detection.
While these sensors may not be the best choice for active fire detection, they are perfect for detecting burnt areas with a high resolution of up to 10 meters, which is much more detailed than any other solution available can offer. Additionally, the data stored in this feature allows us to estimate the severity of the fire and quantify its effects on the vegetation and topsoil.
How the Burnt Area Processor Works
Our Burnt Area feature utilizes the latest technology to detect burnt areas fast using four high-resolution satellites – Sentinel-2A, Sentinel-2B, Landsat-8, and Landsat-9. By reducing the time between image acquisitions, we can leverage our knowledge of active or recently burning fires to identify potential burnt areas. We use a time-series-based approach to detect burnt areas by analyzing the change in Normalized Burn Ratio (NBR) – a spectral index that detects burnt vegetation and charcoal.
After identifying the potential burnt areas, we subject them to a sequence of tests to verify true detections and to eliminate false detections caused by, for example, newly cleared forests or harvested fields. Finally, we classify the remaining burnt areas using the USGS Burnt Area severity classification scheme and present the results to our customers.
While it may seem like a straightforward process, our Burnt Area feature requires many steps, including loading satellite products, correcting atmospheric effects, homogenizing Sentinel-2, Landsat-8, and Landsat-9 data, identifying potential burnt areas, removing cloud-affected pixels, and mapping and verifying the burnt areas. Our commitment to quality ensures that our customers receive the most accurate information possible.
Choosing between Burnt Area and Active Fire Features: Understanding the Differences
In conclusion, the Burnt Area feature offers significant advantages over the Active Fire feature in terms of higher spatial accuracy and more detailed insights into fire severity.
We are confident that our Burnt Area feature will provide you with detailed and accurate insights for effective and sustainable fire management, post-event analysis, and pre-event preparation. It is important to note that our Burnt Area feature complements our Active Fire feature, and both are crucial tools for protecting your assets. Please do not hesitate to contact our Wildfire Experts if you have any questions or would like to learn more.