The Bigger Picture: Using Global Wildfire Analytics for Better Fire Analysis
As wildfires continue to be a global problem, governments, commercial forestry, and other organizations benefit from the ability to monitor and detect fires promptly and reliably. At OroraTech, we are expanding our satellite-based Wildfire Solution to include advanced analytics based on our extensive data archive. The new feature is already available for a selected group of Wildfire Solution users and comes together as a part of the WFS analytics package.
The insights gathered through the wildfire analytics dashboard can be used to identify trends and patterns in wildfire activity over time and improve our understanding of fires and their impacts. Our data can help us better understand wildfire behavior in a given area and develop strategies for wildfire management and suppression.
Key benefits of using this data include:
- Having an overview of the past fire seasons in terms of fire frequency, duration, and area affected all stored in one place
- Receiving insights on trends, patterns, and anomalies for better planning of the upcoming fire seasons
- Getting reporting support for commercial forestries and firefighting agencies.
Understanding Australia’s Shifting Fire Patterns with Wildfire Analytics
To showcase the new analytics feature, let’s have a closer look at the fire patterns in a coastal region of New South Wales, Australia.
Australia covers a vast geographical area with various climate zones and vegetation ranging from grassland and open woodlands in the north to forests and shrubland in the south. Given this combination of climate and vegetation, there is always a fire season somewhere in Australia throughout the year. This is especially visible in the presented video.
Fire detection days in Australia from December 2021 to May 2022. Source: OroraTech
While the North usually burns during winter and spring, the South gets on fire in summer and autumn. However, not all years are the same when it comes to fire risk and activity. Therefore, analyzing historical data on wildfires can help to deepen our understanding of the country’s fire pattern and become a game-changer in the land management strategies of the region.
Analyzing Regional Fire Cycles with Wildfire Data Archive
While the large-scale statistics show the overarching trend, the actual impact on individual regions, like the areas we monitor for our users, can vary strongly depending on their geographic region. To fully comprehend this, let’s return to the example of the eastern coastline of New South Wales in Australia and analyze its wildfire data from June 2022 until December 2022.
1. Wildfire analytics dashboard overview for quick information access
To start with, we need to select a period to analyze historic fire seasons in the area of interest. Then we can see how many fires occurred, how large the affected area was, and how the fire season changed compared to the years before.
Equally, by selecting a period, we better understand when the past fire seasons started and reached their peaks. The wildfire analytics dashboard contains different types of valuable data. For example, we can see how fire duration relates to fire size or what types of fires occur most frequently.
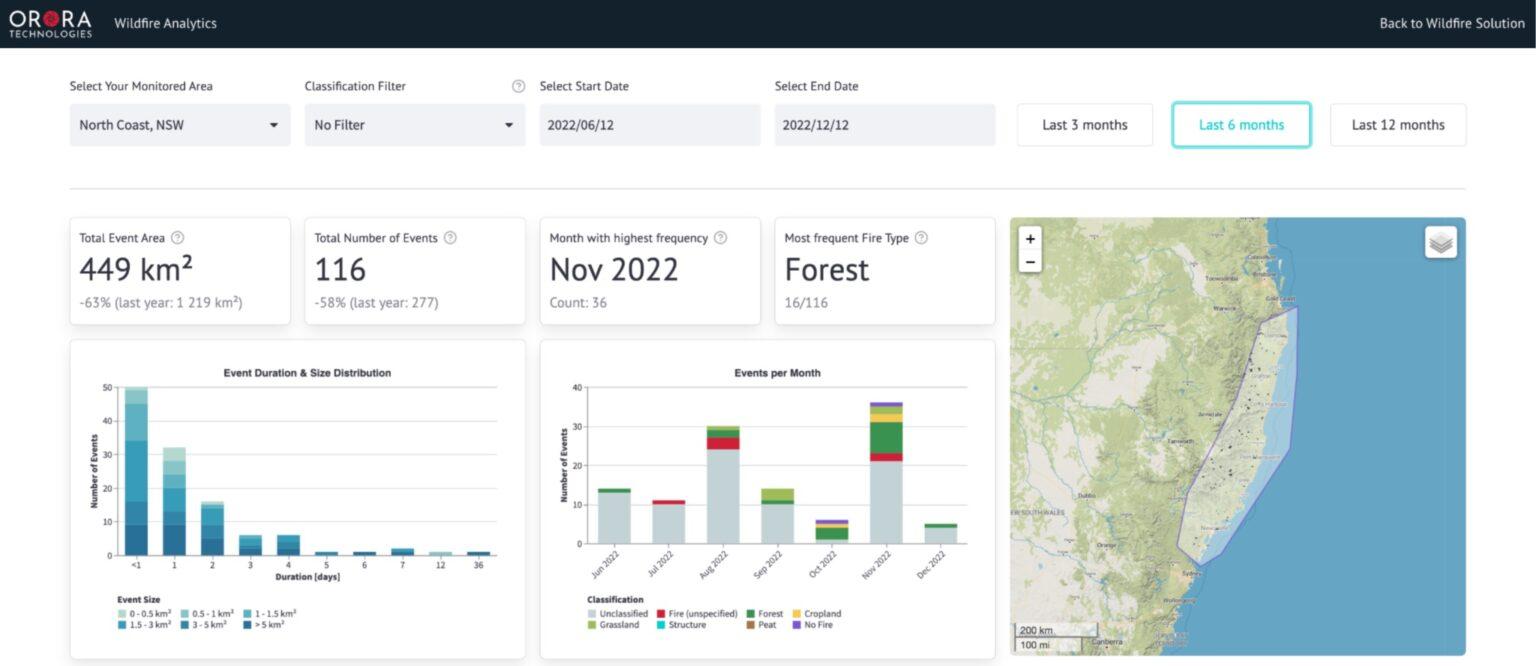
The data overview shows that the total number of fires has dropped by 58% compared to last year. In addition, the total area of these fires has been reduced by 63%. The most fires occurred in November, and forest fires are responsible for 16 out of 116. With this dashboard, we aim to support organizations with more precise risk estimation, strategic planning for upcoming fire seasons, and improved reporting on historic fire periods.
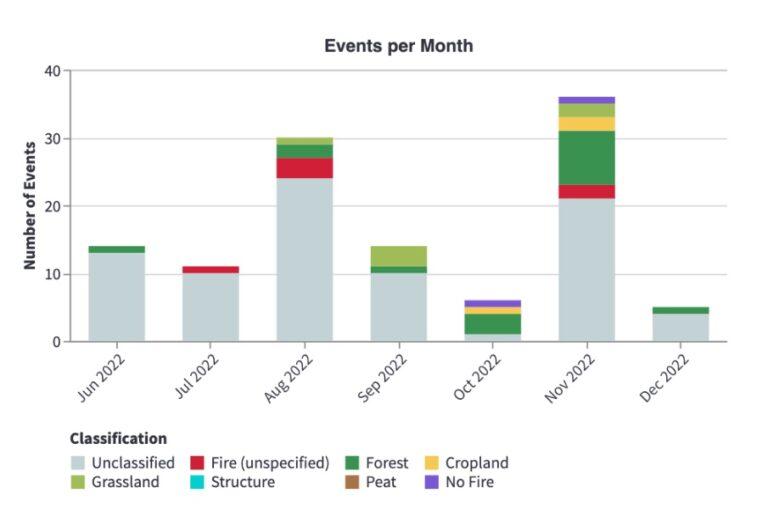
2. The “Events per Month” feature for anomalies recognition
In the “Events per Month” chart, we can see the anomalies recognized by our system in New South Wales, Australia. For the east coast of New South Wales, most of the occurrences happened in November 2022, including many classified as grassland and forest fires. It is essential to know the types of fires affecting a selected area and their potential impacts.
3. The “Event Duration & Size Distribution” feature for better planning and suppression effort evaluation
Our fire duration feature examines how long the fire was active in relation to the size of the fire. Fire duration is determined from the first occurrence of a hotspot to the last detection of a hotspot. Fire size and duration are influenced by local environmental conditions such as fuel availability, weather, and human interactions, e.g. suppression efforts.
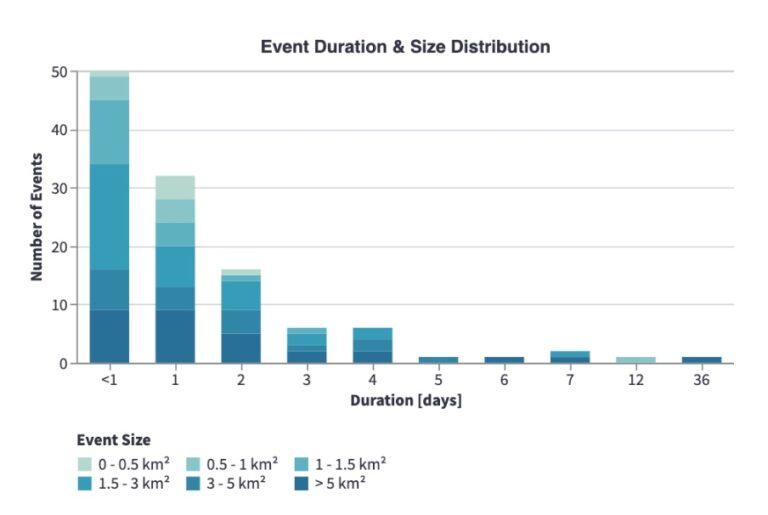
From the graph above, one can see that the majority of fires of different sizes last no longer than a day. Only a few fires continue to burn for more than five days. Also, for instance, small fires, such as those caused by lightning, can often be easily managed and contained, while larger ones require more effort and time to eliminate.
The fire duration data clearly shows the importance of early fire detection. The earlier a fire is discovered, the faster the extinguishing process can be started and the lower the material will be done to the forest assets.
4. The “Events per Area” feature for upcoming fire season planning
Knowing which area was affected the most during the fire season can provide valuable insights into fire behavior in this particular region and help emergency responders and firefighters develop strategies for managing and combating future fires. This information can also be used to identify potential areas for fire prevention and management efforts, and support research on fire behavior and its environmental impacts.
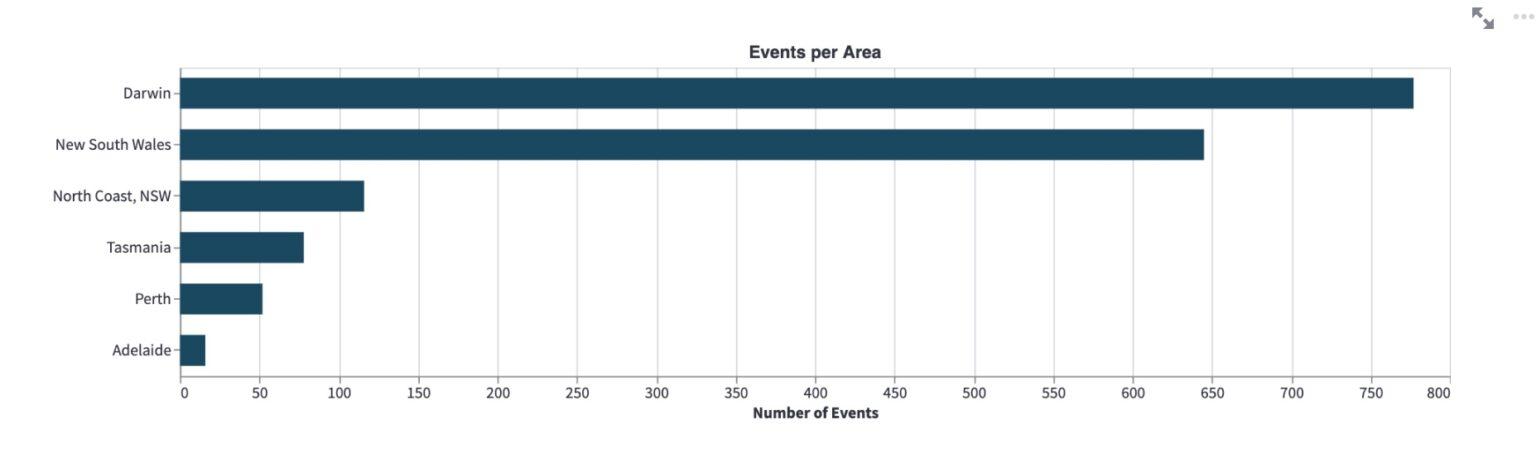
Thus, the graph above shows that most fire events usually occur in Queensland and the Northern Territory of Australia, while Victoria and Tasmania seem to be relatively calm. This data type is particularly beneficial for Governmental organizations and large forestry companies, which require multiple and extensive forest territory management.
The Source of Wildfire Analytics Dashboard Data
The data analysis is based on our large global data archive, which contains thermal hotspots derived from more than 20 satellites with spatial resolutions varying between 10 m (Sentinel-2) and 3 km (Meteo-Sat). These hotspots are spatially and temporarily grouped into so-called "events," which can be classified into different fire types.
Current platforms, such as GWIS, only offer MODIS and VIIRS data for the whole of Australia without the ability to filter by dates or regions. Our Wildfire Solution, on the contrary, is based on data gathered from over 20 satellites, which can be filtered by selected dates and customized by the regions.
What’s Next for Dashboard Analytics?
The features presented above are only the beginning of our wildfire analytics platform. Further analyses of the correlation between fire and precipitation, wind, or relative humidity are already in progress. Soon, our customers will be able to find out what weather conditions are the leading cause of fires, discover if drier weather conditions lead to more fires and wet months to fewer, and many more insights.
Stay tuned for the next release of the analytics dashboard with extended capabilities.