Fire Grid: a clearer way to understand large wildfires
Fire Grid: a clearer way to understand large wildfires
As wildfire activity becomes more intense and widespread, the amount of satellite hotspot data generated during major incidents has grown dramatically. While this increase in detection capability is valuable, it also creates a new challenge: visual overload.
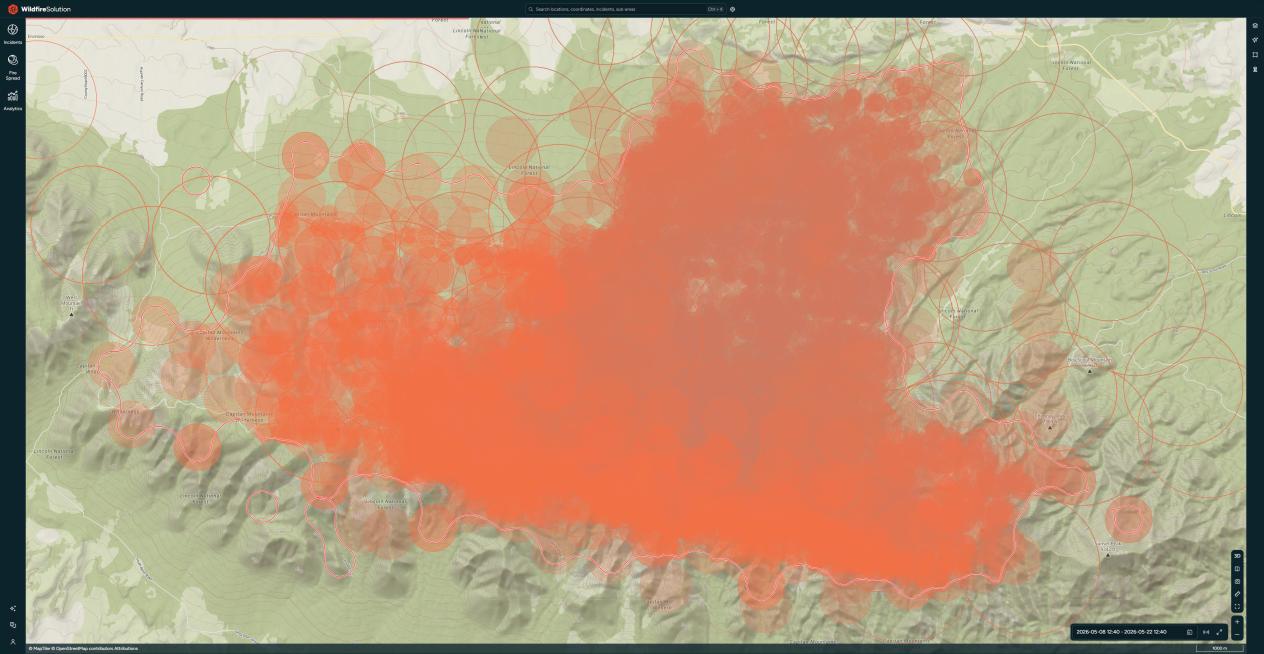
During large wildfire events, thousands of overlapping hotspot detections can quickly become difficult to interpret; instead of helping users understand the fire, traditional point-based visualizations often become cluttered and noisy - especially when monitoring fires over long periods of time.
That is exactly the problem Fire Grid was designed to solve.
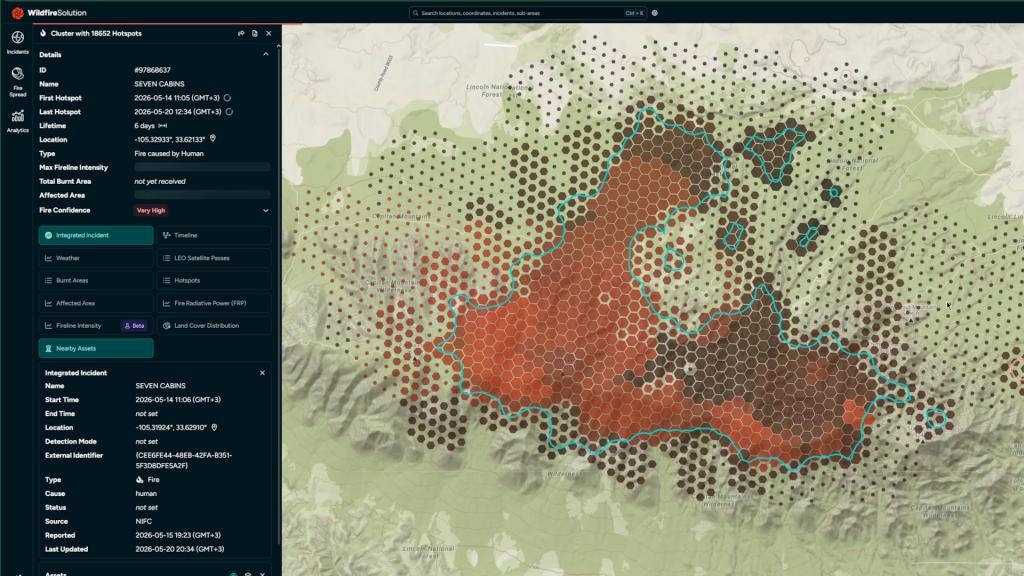
The same fire with a normal cluster view and the new Fire Grid view
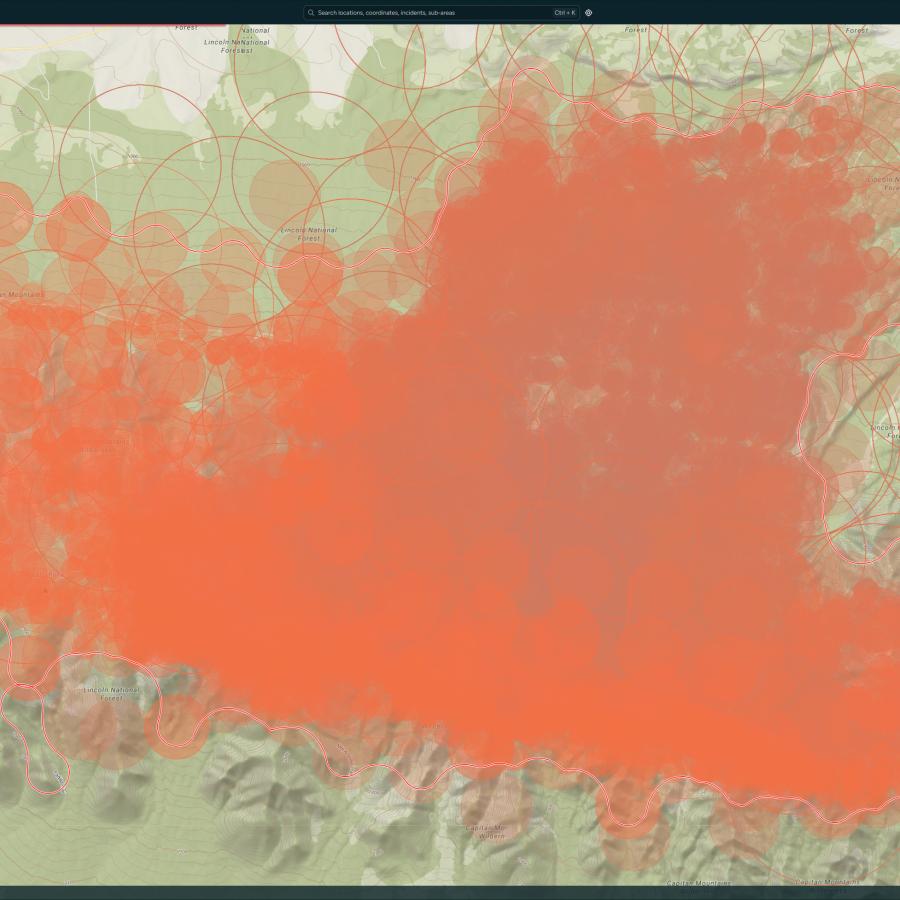
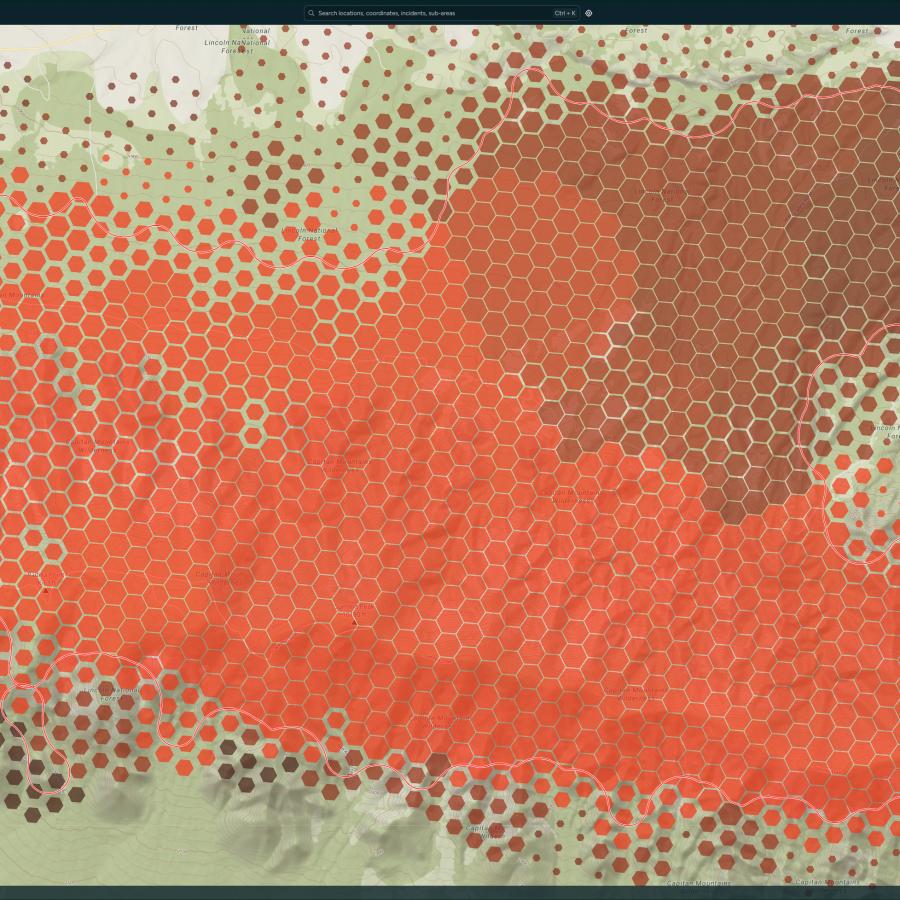
Fire Grid is a new wildfire visualization layer within Wildfire Solution that transforms dense hotspot detections into a cleaner, more structured operational view. Rather than displaying every individual hotspot as a separate marker, Fire Grid groups nearby detections into hexagonal cells, creating a simplified representation of fire activity that is easier to monitor at scale.
The result is a much clearer picture of how a fire is evolving over time.
Importantly, Fire Grid is not intended to replace traditional hotspot detections. Individual hotspot circles remain the best tool for early detection, identifying ignition points, and inspecting smaller events in great detail. Fire Grid serves a different purpose: helping users understand large and complex fires once hotspot density becomes too high for traditional visualization methods to remain effective.
In practice, this makes Fire Grid particularly valuable for ongoing wildfire monitoring, situational awareness, and understanding fire progression during active incidents.
A geospatial basis
The technology behind Fire Grid is intentionally designed around simplicity and scalability. Under the hood, hotspot detections are aggregated into a global hexagonal grid system using the H3 geospatial indexing framework - an industry-standard approach originally developed by Uber for large-scale spatial analytics.
The original challenge the team set out to solve was straightforward: large wildfire events were generating so many hotspot detections that traditional point-based visualizations became difficult to interpret. Thousands of overlapping circles created visual noise, making it harder for users to understand the overall shape and progression of a fire.
Fire Grid was designed to flatten that noise into something more readable.
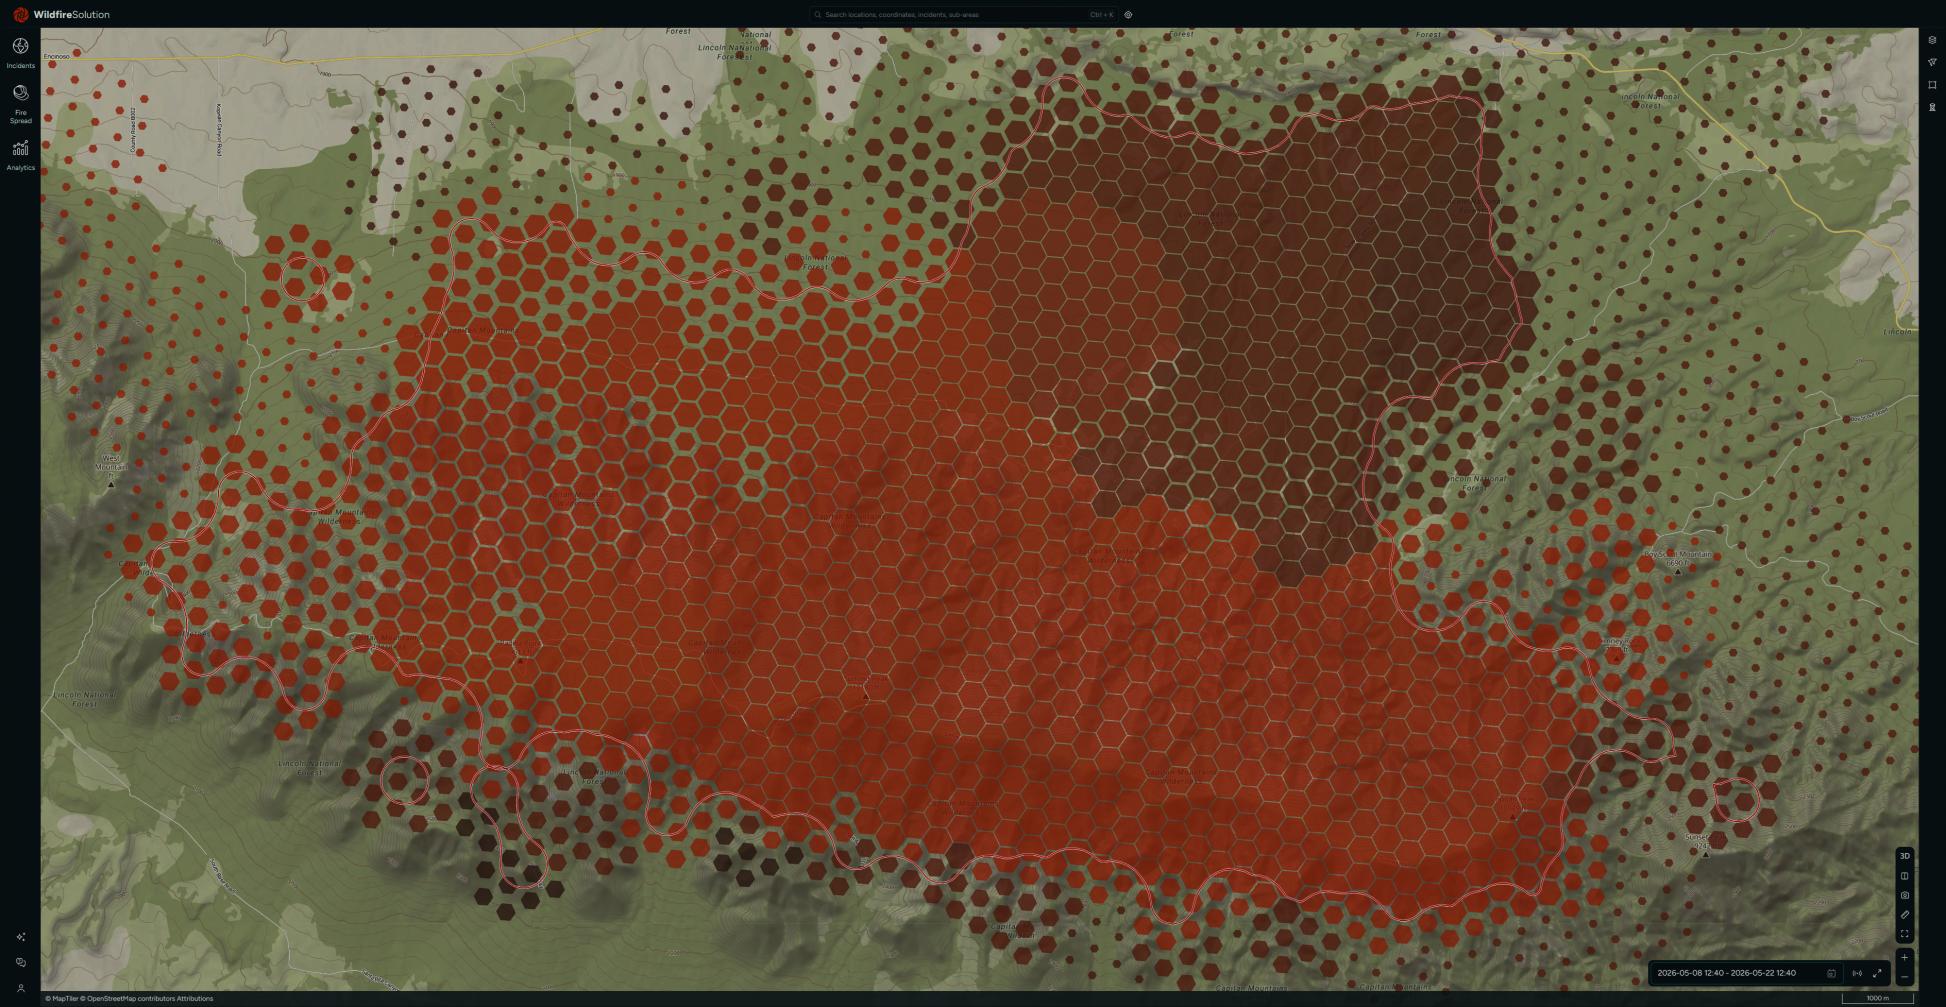
Instead of rendering every detection individually, the system groups nearby hotspots into hexagonal cells that provide a cleaner operational overview while still preserving the spatial behavior of the fire. Newer activity is visually emphasized, while older detections fade into the background, helping users focus on what matters most in real time.
“We ultimately decided to scale hex sizes based on uncertainty to improve how reliably the data is interpreted. This iteration enhances visual clarity for end users by allowing the system to reduce the visual impact of information that may be less certain, giving them a clearer understanding of data quality.”
— Joseph Miclat, Senior Software Engineer
The decision to use H3 was both practical and technical. Unlike square grids, hexagonal systems provide more uniform spatial relationships between cells, making distance and adjacency calculations simpler and more computationally efficient. This allows Fire Grid to perform fast, on-the-fly aggregations directly within the current map view, without requiring expensive pre-processing pipelines.
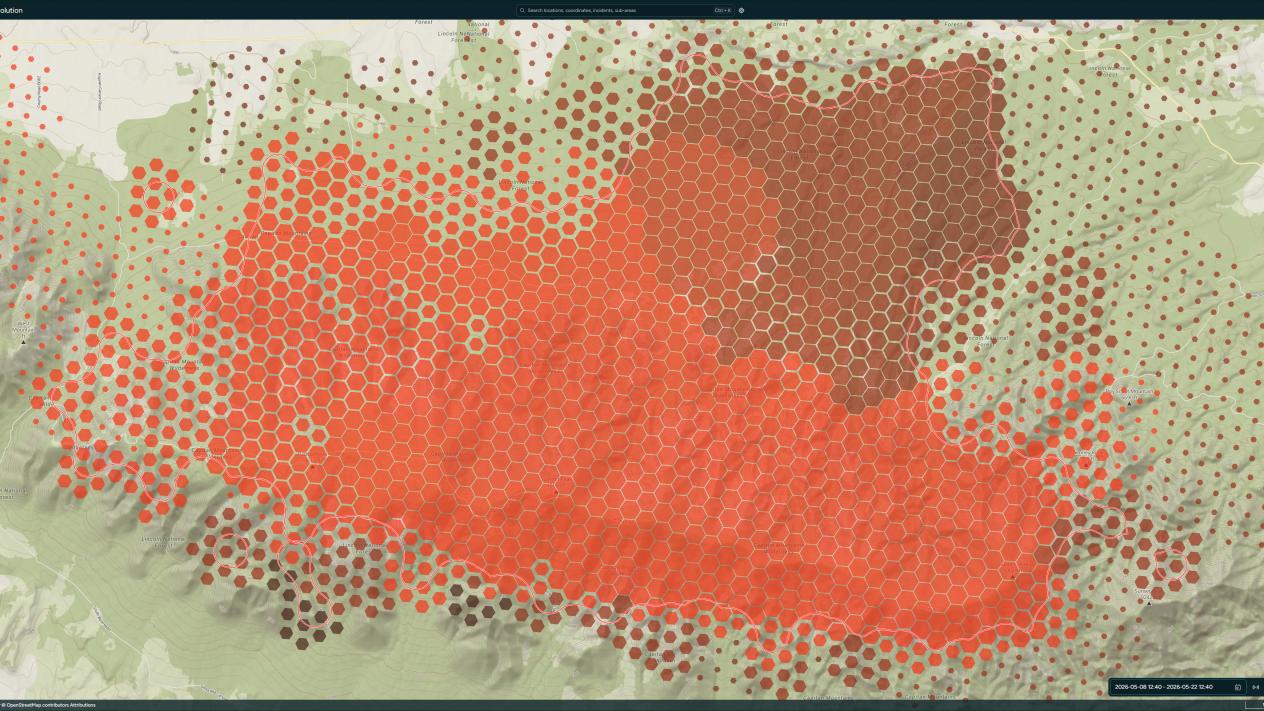
As users zoom in and out, the visualization dynamically adjusts detail levels using stacked grid resolutions. The team also introduced additional refinements during development to better communicate uncertainty and data quality. One of the final design iterations before release involved scaling hexagon sizes based on location confidence and satellite ground sample distance (GSD). More precise detections appear more prominent, while lower-confidence data is visually softened to reduce potential misinterpretation.
The result is a visualization system that balances performance, clarity, and operational usability - especially during large and fast-moving wildfire events.
Intuitive Design
The visualization itself also communicates important information intuitively. Color represents recency, with brighter red hexagons indicating newer detections and darker cells representing older activity. Hexagon sizing reflects confidence in fire location, based largely on satellite ground sample distance and detection precision.
This creates a visualization that is not only cleaner but also more informative.
“Our goal with the design of this visualization was to make the depth and richness of our data accessible and actionable, particularly in the context of larger fires. We explored a wider range of possible approaches, even creating our own visualization tool to dial in the right design. I would also like to thank all the firefighters and fire analysts from around the world who gave their ideas and feedback during the development processes.”
— Lachlan Philipson, Senior UX/UI Designer
For wildfire teams managing large incidents, the ability to quickly interpret changing fire behavior is critical. Fire Grid helps transform thousands of detections into a coherent operational picture, making it easier to monitor spread, identify active regions, and communicate fire evolution clearly across teams and stakeholders.
The difference becomes especially noticeable during very large fires. Smaller incidents are often best viewed using traditional hotspot circles, where precise ignition points matter most. But as fires grow and hotspot density increases, Fire Grid provides a much more scalable way to understand the overall situation without overwhelming the user.
In many ways, Fire Grid reflects a broader shift in wildfire intelligence: moving from raw detections toward more interpretable operational products.
And this is only the beginning.
While Fire Grid currently focuses on hotspot visualization, the same grid-based approach establishes a foundation for future wildfire analytics. Over time, additional layers such as Fire Radiative Power (FRP), intensity measurements, and other spatial fire datasets could be integrated into the same framework, creating richer and more dynamic wildfire intelligence products.
As wildfire monitoring continues to evolve, clarity becomes just as important as detection itself.
Fire Grid was built to deliver both.