Wildfire Solution - Distance to Assets & Wildfire Analytics Update
Wildfire Solution - Distance to Assets & Wildfire Analytics Update
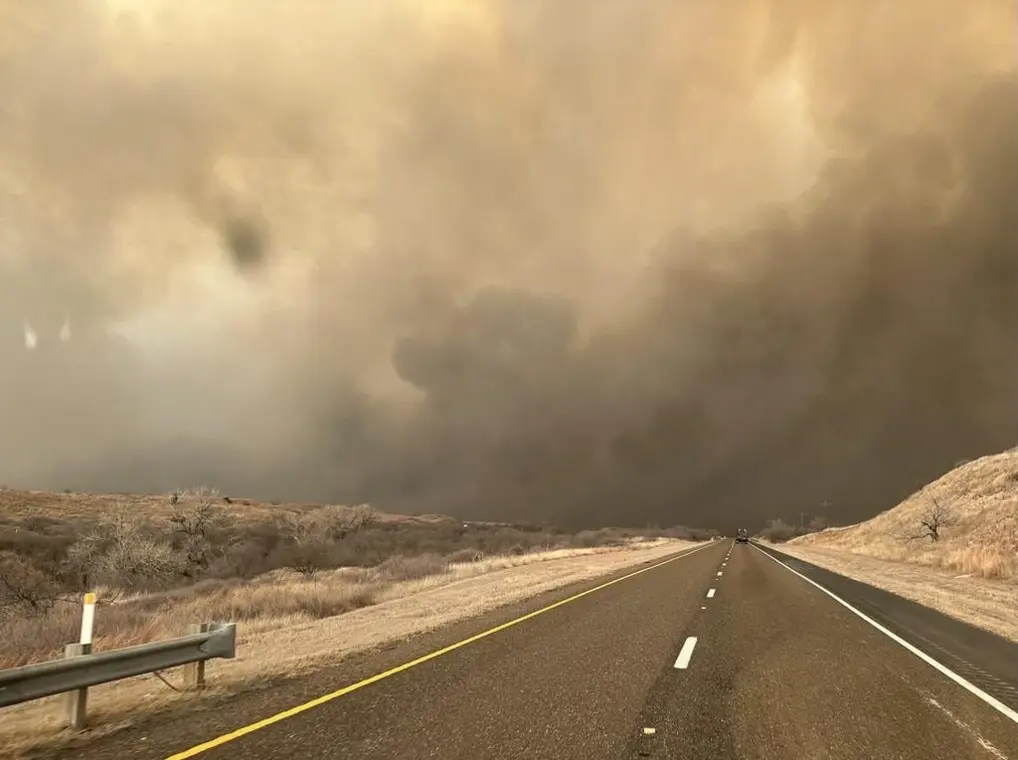
In wildfire management, every second counts - and so does every kilometer (or mile for the Americans). When you're protecting critical infrastructure, monitoring operational zones, or planning for the season ahead, visibility is everything. That’s why we’re introducing a few new powerful capabilities within Wildfire Solution that bring your assets and wildfire data together in one ecosystem.
Take Control with User-Defined Assets
Previously, users couldn’t define and manage their own ground assets like buildings or powerlines within the platform. This meant limited visibility into whether active fires were threatening critical infrastructure, property boundaries, or operational areas - making proactive planning and rapid response more difficult.
In our newest updates, that changes.
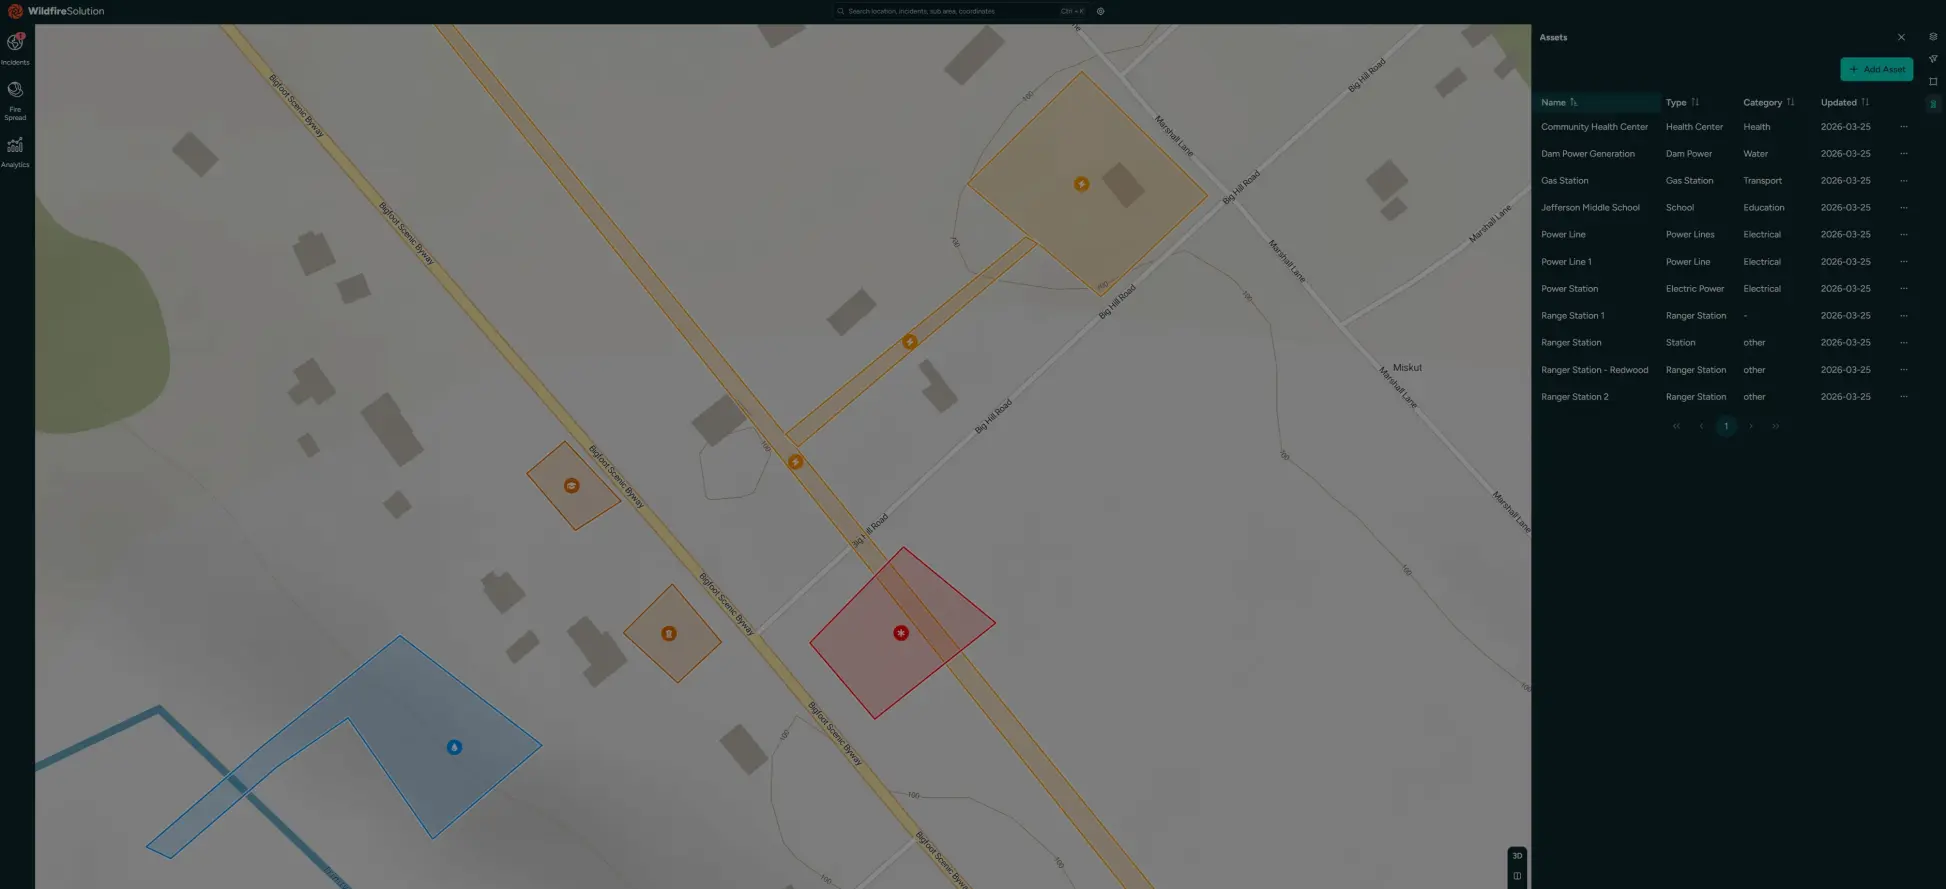
With User Assets, you can:
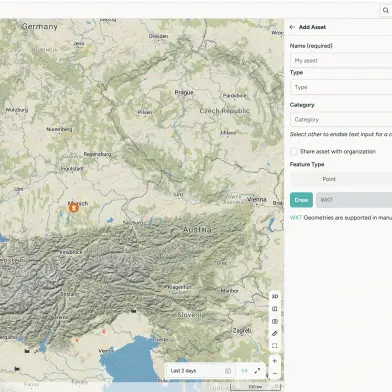
Manually create assets as points, lines, or polygons
Upload assets via Shapefile or GeoJSON
Automatically include assets in nearby fire detection analysis
Toggle the User Asset layer on or off
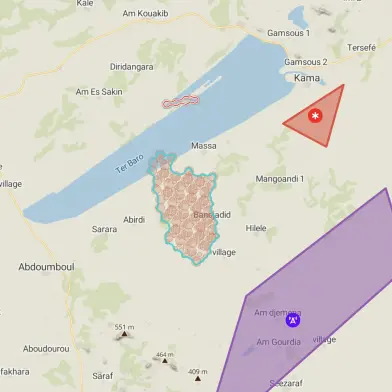
Instantly see whether fires are approaching your defined areas
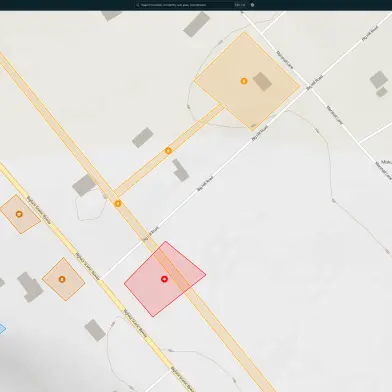
This feature gives you clarity to track how close a fire is coming to your property, buildings, infrastructure, or anything else you define. Along with that, we have also introduced:
Nearby Assets – Distance Table: Real-Time Risk Clarity
Knowing that a fire is “nearby” isn’t enough. You need to know how close it actually is, and how fast that distance is changing.
The new Nearby Assets – Distance Table provides continuous, real-time visibility into fire proximity.
The table appears when:
You’ve created User Assets, and
A fire cluster is detected within 10 km of those assets.
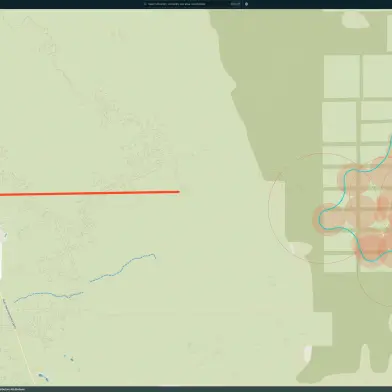
When these conditions are met, a distance table automatically becomes available within the cluster details view. Expanding the table reveals:
A list of affected assets
The current distance between the fire cluster and each asset
Dynamically updating measurements as the fire perimeter grows or contracts
This transforms static awareness into actionable intelligence. Operations teams can prioritize suppression strategies, inform initial attack decisions, and assess exposure risk with confidence.
Wildfire Analytics: See the Bigger Picture
While real-time monitoring is essential, long-term insight is equally critical for strategic planning.
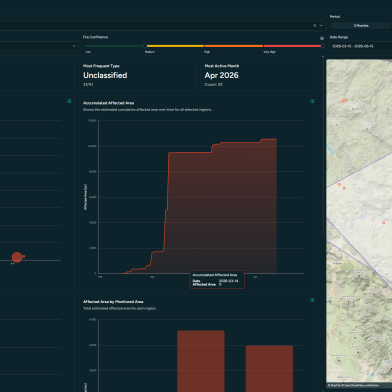
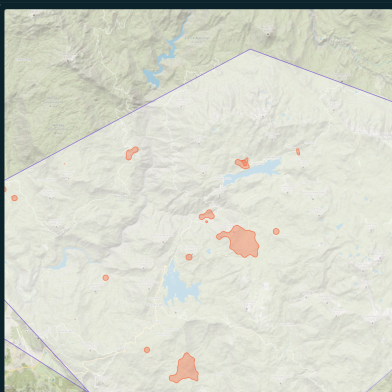
Wildfire Analytics provides a centralized view of wildfire activity within your Area of Interest—all in one place.
With powerful filtering capabilities, you can:
View the total number of fires
Analyze the total fire burn area
Examine specific burnt areas on the map
Filter data by date—including historical records going back to 2020
This allows you to:
Identify long-term wildfire trends
Prepare more effectively for upcoming seasons
Support mitigation and prevention planning
Generate fast, data-backed reports
Instead of manually compiling scattered information, you gain structured, visualized insights that support both operational decisions and executive reporting.
A Unified Approach to Wildfire Intelligence
Together, these capabilities create a seamless workflow:
Define what matters with custom User Assets.
Monitor real-time proximity with dynamic distance tracking.
Plan strategically using historical and trend-based wildfire analytics.
The result? Greater situational awareness, faster decision-making, and smarter wildfire management - today and for the seasons ahead.
Stay in orbit with our newsletter
Read more from OroraTech